Rainfall, freeze-thaw, tree canopy, hail, and housing age — combined into one open dataset ranking every state by how hard it works a gutter system.
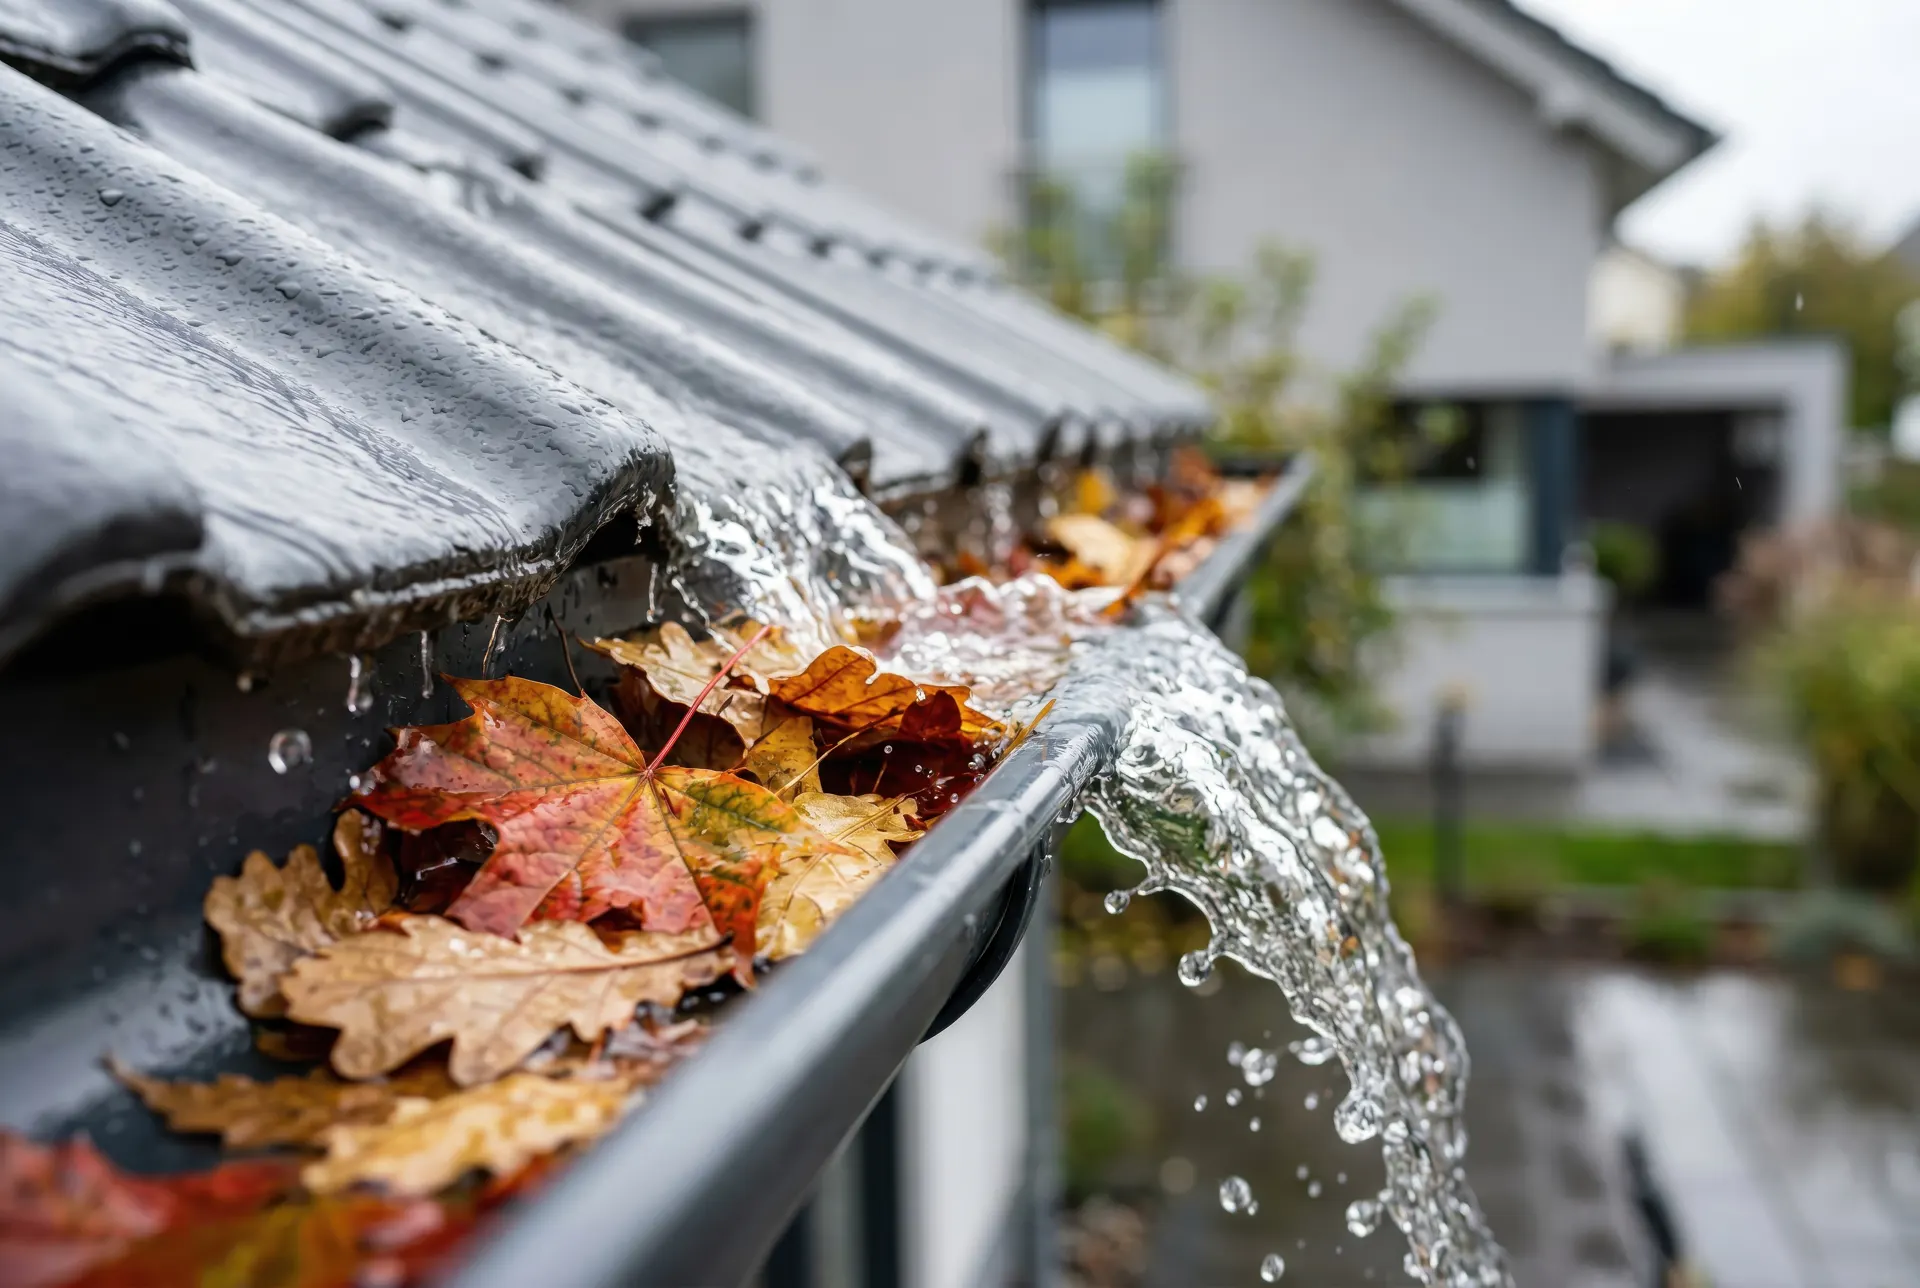
Each state scores 0–100 on five factors, weighted into the composite: rainfall volume 30% (NOAA annual normals, min-max normalized), freeze-thaw 25% (cycle-frequency class from NOAA normals), tree canopy 20% (USFS canopy class → debris load), hail/severe exposure 15% (NOAA SPC climatology class), housing age 10% (Census ACS 2023 median year built, 1955→100 to 2000→0). Modeled lifespans scale baseline material life (vinyl 15 / aluminum 20 / steel 25 / copper 50 years) by each state's stress multiplier (0.75×–1.25×). The full per-state table and every subscore ship in the CSV.
| Rank | State | Composite | Rain | Freeze-Thaw | Canopy | Hail | Modeled Aluminum Life |
|---|---|---|---|---|---|---|---|
| 1 | New York | 75.8 | 64.0 | 100 | 100 | 15 | 17.7 yrs |
| 2 | Connecticut | 74.9 | 76.0 | 72 | 100 | 45 | 17.8 yrs |
| 3 | Maine | 74.2 | 72.0 | 100 | 100 | 15 | 17.8 yrs |
| 4 | New Hampshire | 73.1 | 70.0 | 100 | 100 | 15 | 17.9 yrs |
| 5 | Michigan | 72.4 | 48.0 | 100 | 100 | 45 | 18.0 yrs |
| 6 | Vermont | 72.4 | 66.0 | 100 | 100 | 15 | 18.0 yrs |
| 7 | Pennsylvania | 71.7 | 64.0 | 72 | 100 | 45 | 18.0 yrs |
| 8 | Massachusetts | 70.7 | 74.0 | 72 | 100 | 15 | 18.1 yrs |
| 9 | Arkansas | 69.4 | 80.0 | 45 | 100 | 75 | 18.2 yrs |
| 10 | Missouri | 69.1 | 64.0 | 72 | 60 | 100 | 18.3 yrs |
| 11 | Alabama | 68.9 | 96.0 | 22 | 100 | 75 | 18.3 yrs |
| 12 | West Virginia | 66.6 | 70.0 | 72 | 100 | 15 | 18.5 yrs |
| 13 | Tennessee | 66.3 | 84.0 | 45 | 100 | 45 | 18.5 yrs |
| 14 | Indiana | 65.8 | 64.0 | 72 | 60 | 75 | 18.5 yrs |
| 15 | Illinois | 65.3 | 58.0 | 72 | 60 | 75 | 18.6 yrs |
| 16 | Kentucky | 64.8 | 76.0 | 45 | 100 | 45 | 18.6 yrs |
| 17 | North Carolina | 64.2 | 80.0 | 45 | 100 | 45 | 18.7 yrs |
| 18 | Minnesota | 63.9 | 36.0 | 100 | 60 | 75 | 18.7 yrs |
| 19 | Mississippi | 63.6 | 94.0 | 22 | 100 | 45 | 18.7 yrs |
| 20 | Wisconsin | 63.1 | 46.0 | 100 | 60 | 45 | 18.8 yrs |
| 21 | Virginia | 62.0 | 68.0 | 45 | 100 | 45 | 18.9 yrs |
| 22 | Louisiana | 60.8 | 100.0 | 0 | 100 | 45 | 19.0 yrs |
| 23 | Ohio | 60.8 | 58.0 | 72 | 60 | 45 | 19.0 yrs |
| 24 | Georgia | 58.2 | 80.0 | 22 | 100 | 45 | 19.2 yrs |
| 25 | South Carolina | 57.0 | 76.0 | 22 | 100 | 45 | 19.3 yrs |
| 26 | South Dakota | 56.9 | 24.0 | 100 | 25 | 100 | 19.3 yrs |
| 27 | Rhode Island | 56.4 | 74.0 | 45 | 60 | 15 | 19.4 yrs |
| 28 | Montana | 55.7 | 10.0 | 100 | 60 | 75 | 19.4 yrs |
| 29 | Iowa | 55.1 | 48.0 | 72 | 25 | 75 | 19.5 yrs |
| 30 | Maryland | 55.1 | 68.0 | 45 | 60 | 45 | 19.5 yrs |
| 31 | Kansas | 55.0 | 38.0 | 72 | 25 | 100 | 19.5 yrs |
| 32 | New Jersey | 54.6 | 74.0 | 45 | 60 | 15 | 19.6 yrs |
| 33 | District of Columbia | 54.3 | 64.0 | 45 | 60 | 15 | 19.6 yrs |
| 34 | Nebraska | 53.8 | 34.0 | 72 | 25 | 100 | 19.6 yrs |
| 35 | Colorado | 52.1 | 14.0 | 100 | 25 | 100 | 19.8 yrs |
| 36 | Oregon | 52.0 | 66.0 | 22 | 100 | 15 | 19.8 yrs |
| 37 | Oklahoma | 51.3 | 52.0 | 45 | 25 | 100 | 19.9 yrs |
| 38 | Wyoming | 51.2 | 6.0 | 100 | 25 | 100 | 19.9 yrs |
| 39 | North Dakota | 50.3 | 16.0 | 100 | 25 | 75 | 20.0 yrs |
| 40 | Delaware | 49.6 | 70.0 | 45 | 60 | 15 | 20.0 yrs |
| 41 | Washington | 48.1 | 56.0 | 22 | 100 | 15 | 20.2 yrs |
| 42 | Florida | 47.8 | 88.0 | 0 | 60 | 45 | 20.2 yrs |
| 43 | Texas | 46.1 | 38.0 | 22 | 60 | 100 | 20.4 yrs |
| 44 | New Mexico | 40.2 | 8.0 | 72 | 25 | 75 | 21.0 yrs |
| 45 | Idaho | 39.9 | 18.0 | 72 | 60 | 15 | 21.1 yrs |
| 46 | California | 32.3 | 24.0 | 22 | 60 | 15 | 21.9 yrs |
| 47 | Utah | 29.1 | 6.0 | 72 | 25 | 15 | 22.3 yrs |
| 48 | Arizona | 20.8 | 6.0 | 22 | 25 | 45 | 23.4 yrs |
| 49 | Nevada | 19.4 | 0.0 | 45 | 25 | 15 | 23.6 yrs |
Scores 0–100 per factor. Data: NOAA normals & SPC climatology, USFS canopy, Census ACS 2023. Dataset CC BY 4.0 — download the CSV.
Five weighted factors, each normalized 0–100: rainfall volume (30%), freeze-thaw cycling (25%), tree-canopy debris load (20%), hail/storm exposure (15%), and housing age (10%). Sources: NOAA climate normals, NOAA SPC severe-weather climatology, USFS tree-canopy classes, and US Census ACS median year built. Full methodology and the complete dataset are on this page, downloadable under CC BY 4.0.
New York ranks #1 with a composite stress score of 75.8, driven by its combination of freeze-thaw cycling, debris load, and storm exposure. The top five are New York, Connecticut, Maine, New Hampshire, Michigan.
The gentlest five are Nevada, Arizona, Utah, California, Idaho — low freeze-thaw counts and lighter debris loads dominate the bottom of the table. Even there, undersized or clogged systems still fail; the index measures environment, not maintenance.
We scale baseline material lifespans (vinyl ~15 yrs, aluminum ~20, steel ~25, copper ~50) by each state's stress multiplier (0.75× to 1.25×). A high-stress state shortens aluminum's modeled life toward 16 years; a benign one stretches it past 26. It's a planning number, not a warranty.
Yes — the dataset is published under CC BY 4.0. Download the CSV, cite 'GutterLinker Gutter Stress Index 2026' with a link to this page, and use it freely, commercially included.
It means your environment consumes gutter life faster — inspection intervals matter more, material choice matters more, and deferred repairs get expensive sooner. The actual verdict on your system takes a ladder and a licensed pro, which is what the free referral line is for.
Get the system inspected before the climate collects — free licensed-pro referral: (888) 650-1415
Call (888) 650-1415 Now Gutter